NEW YORK / WASHINGTON, May 13, 2026 —
Key Takeaways
- April CPI came in at 3.8% year-over-year — the highest since early 2023 — with gasoline up 35.2% and energy up 31.5% driving the headline surge while core inflation at 3.2% remains stubbornly above the Federal Reserve’s 2% target, making a rate cut at the June FOMC meeting essentially impossible under any conventional monetary policy framework.
- The Brown University Iran War Energy Cost Tracker now estimates total additional household gasoline and diesel costs at $47 billion since February 28 — equivalent to approximately $360 per household — with the pace of accumulation accelerating as gasoline prices hit $4.52 nationally and diesel remains just 18 cents below its all-time record.
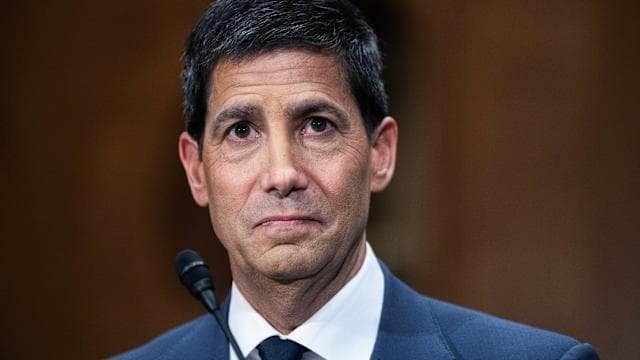
- Federal Reserve Chair Kevin Warsh — in his first full week in the role — faces a policy environment where the labor market is stronger than feared, inflation is re-accelerating, and the single variable that could unlock a rate cut path is not economic but geopolitical: a deal that reopens the Strait of Hormuz and begins unwinding the energy shock that is driving every problematic number in Tuesday’s report.
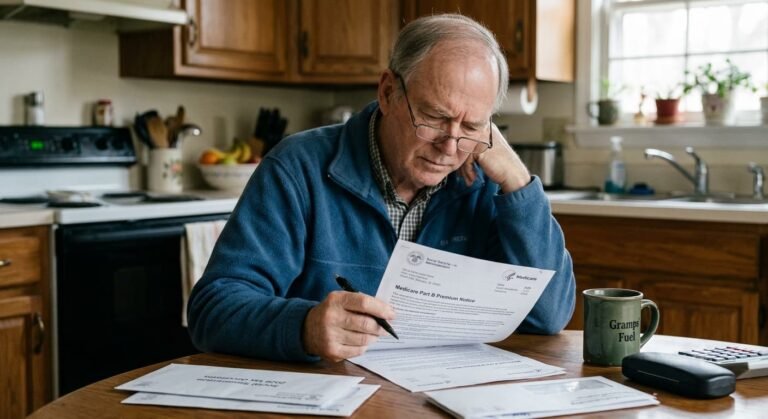
What 3.8% Inflation Actually Means for American Households
The April CPI reading is not an abstraction. It is a measure of how much more expensive the same basket of goods and services costs compared to a year ago. At 3.8%, a household that spent $4,000 per month on expenses in April 2025 is spending approximately $152 more per month for the same lifestyle in April 2026 — $1,824 more per year.
That aggregate number obscures the distribution. The 3.8% headline is a weighted average across all spending categories. Households that drive more — rural families, suburban commuters, workers in industries where driving is job-required — are experiencing inflation significantly above 3.8% because gasoline’s 35.2% increase carries disproportionate weight in their personal spending mix. Households that rent in cities where shelter costs have moderated are experiencing inflation closer to core’s 3.2%. The Iran war’s inflation is not falling equally on all Americans.
The households hit hardest by energy inflation are systematically lower-income. Lower-income households spend a larger share of their budgets on transportation fuel than higher-income households. A family earning $40,000 a year that spends $300 per month on gasoline has seen that cost rise to approximately $405 per month — a $1,260 annual increase representing more than 3% of their total household income. For higher-income households where gasoline is a smaller share of the budget, the same price increase is visible but proportionally manageable. Inflation at 3.8% is not the same inflation for every American.
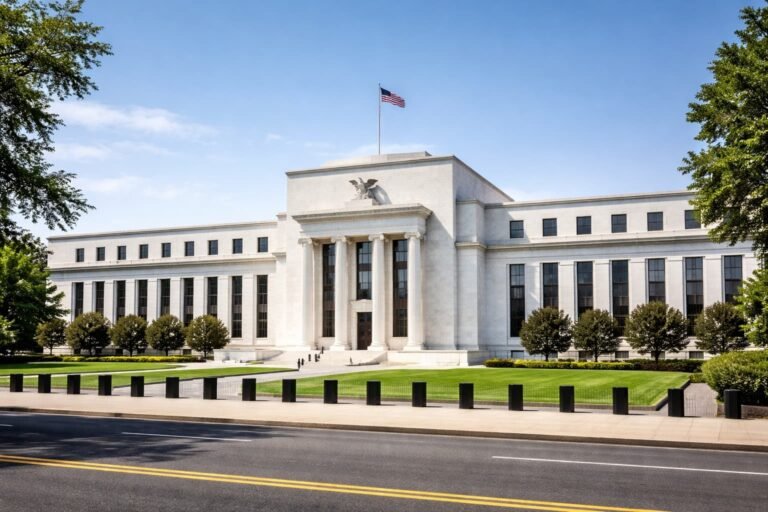
The Fed’s Closed Window — Why Warsh Cannot Cut
The Federal Reserve’s dual mandate requires pursuing both maximum employment and price stability. Maximum employment is effectively achieved — April payrolls beat expectations significantly. Price stability at 2% core inflation is not achieved and is, in April’s data, moving in the wrong direction.
The Taylor Rule — the standard formula economists use to evaluate where interest rates should be given inflation and employment conditions — suggests that at 3.8% headline CPI and 3.2% core, with unemployment at 4.2%, the appropriate federal funds rate is somewhere between 4.0% and 4.5%. The current rate is 3.50% to 3.75% — already accommodative relative to what the data technically justifies.
Kevin Warsh inherits this situation on day nine of his chairmanship. His stated preference for responding to forward-looking market signals rather than lagging data is being tested immediately by data that is itself lagged — April CPI measures price changes that already occurred, not price changes that are coming. If the Iran deal closes this week in Beijing, energy prices will fall in May’s data and June’s data will look dramatically better. Warsh’s correct move may be to do nothing in June, watch the diplomatic calendar, and reassess in July with better information.
| Fed Rate Path Scenarios | Condition | Probable Warsh Response |
|---|---|---|
| Iran deal signed this week | Oil falls to $85-$90 | Hold June, signal cut July |
| Summit produces Hormuz progress but no deal | Oil stays $95-$100 | Hold June, hold July, reassess September |
| Summit fails, ceasefire collapses May 22 | Oil spikes above $120 | Hold indefinitely — possible hike discussion |
| April CPI continues accelerating in May | Core above 3.5% | Hawkish signal — rate hike possibility increases |
What the April Data Means for Mortgage Rates
Mortgage rates track the 10-year Treasury yield, which moves with inflation expectations. Tuesday’s 3.8% CPI reading pushed the 10-year Treasury yield higher in early trading — from approximately 4.35% to 4.48% — as bond investors priced out some of the rate cut probability that had been embedded in yields following last week’s ceasefire extension.
The 30-year fixed mortgage rate, which had fallen below 6% in late April during the peak of deal optimism, moved back above 6.1% Tuesday. For a borrower who locked in a rate at 5.95% last week and is now comparing to today’s 6.1%, the difference on a $400,000 mortgage is approximately $36 per month — $12,960 over the life of the loan. Rate volatility driven by geopolitical uncertainty is a real cost for homebuyers and refinancers who are trying to time their applications around a market that moves 15 to 20 basis points on a single CPI report.
The housing market’s recovery trajectory — purchase applications up 10% month-over-month in April, inventory rising 28% year-over-year — is intact but fragile. A sustained period of rates above 6.25% would meaningfully reduce the pool of qualified buyers at median home prices. Whether rates hold below 6.25% depends on the same diplomatic calendar that the Federal Reserve is watching: Beijing Thursday, ceasefire review May 22.
The Political Arithmetic That Makes This Week Existential
Eleven weeks of the Iran war have produced a specific economic bill that the November midterms will ask American voters to evaluate. Gasoline up 54% from pre-war levels. Consumer sentiment at a 70-year low. Inflation at 3.8% — the highest since 2023. Household energy costs up $360. Spirit Airlines shut down. The Federal Reserve frozen. Mortgage rates above 6%.
Against that bill: a stock market at record highs, April payrolls at 177,000, a ceasefire technically in effect, and a Beijing summit that could — if it produces meaningful Chinese pressure on Iran’s nuclear position — break the diplomatic logjam that has prevented a comprehensive deal for ten weeks.
The Republican Party’s midterm math is straightforward. If the Iran war ends before September, energy prices fall substantially, and the inflation reading in October’s CPI data — released just three weeks before Election Day — shows material improvement, the economic narrative of the midterms shifts. Voters who have been experiencing economic deterioration for seven months will have experienced three months of improvement. Whether three months is enough to offset seven is the question no one can answer with confidence.
If it does not end, October’s CPI will reflect five consecutive months of 35%+ gasoline year-over-year comparisons, consumer sentiment will have been at or near historic lows for six months, and the midterm environment will be the most unfavorable for an incumbent party since 2010.
Beijing Thursday. Ceasefire review May 22. October CPI released October 15. Those three dates are the economic story of 2026.