
WASHINGTON, May 31, 2026 —
Key Takeaways:
- The One Big Beautiful Bill Act, signed July 4, 2025, is now nine months into implementation — and the CBO projects 11.8 million Americans will lose health insurance by 2034, with Medicaid work requirement enforcement accelerating in 2026 across states that have already moved to comply
- American households are simultaneously absorbing an estimated $2,800 in accumulated Iran war energy costs since February 28 alongside the Medicaid and SNAP restructuring — a compound economic pressure that is landing hardest on the bottom 20% of earners, who gain less than 1% of the law’s tax cuts but face the full weight of its benefit reductions
- The intersection of the OBBBA’s safety net reductions and the Iran war’s inflation shock has pushed the University of Michigan consumer sentiment index to 44.2 — an all-time record low — as households at every income level below $75,000 face higher costs, reduced benefits, or both simultaneously in the same calendar year
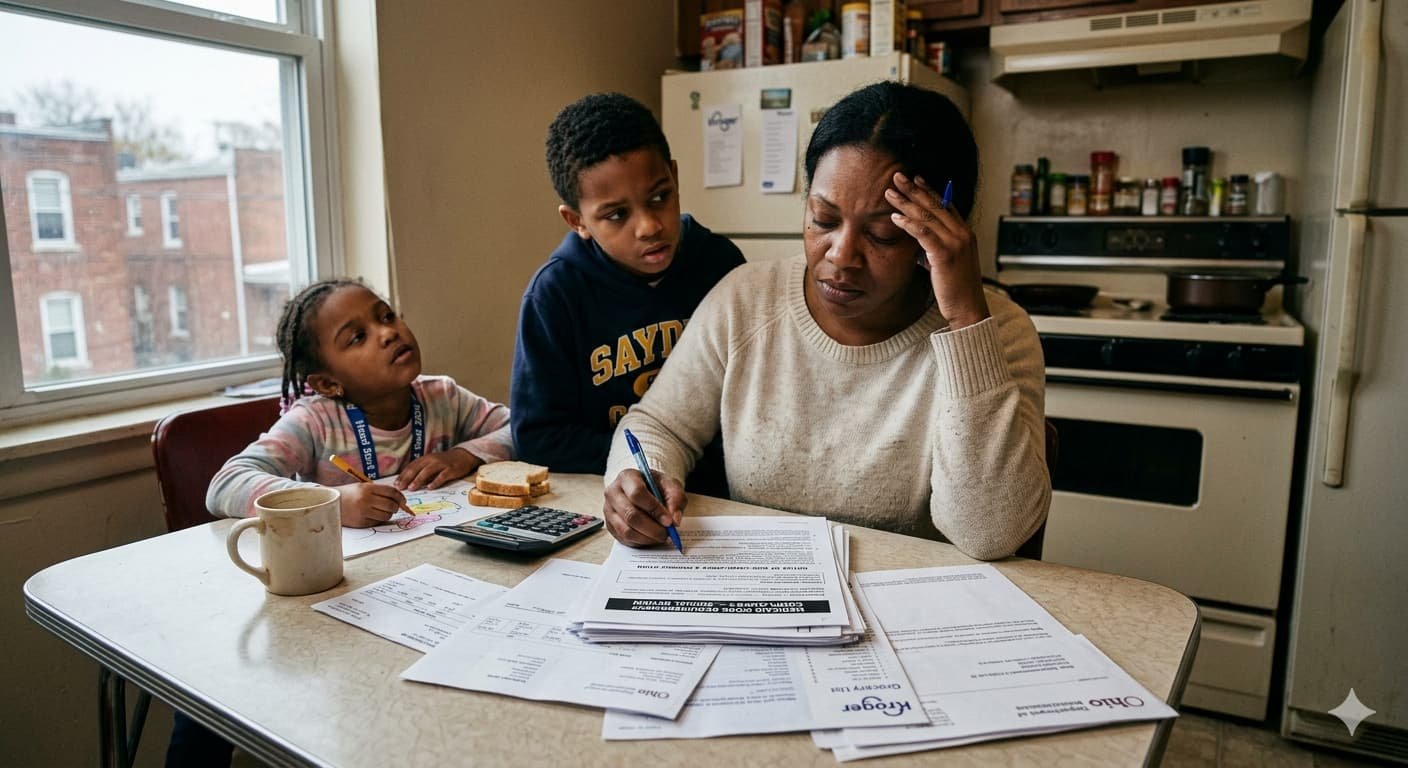
Two of the most consequential economic policy changes in a generation are happening at the same time, to the same Americans, in the same households. The One Big Beautiful Bill Act restructured the federal safety net last summer. The Iran war restructured the energy market last winter. For the 11 million Americans projected to lose Medicaid coverage and the millions more absorbing rising food assistance costs from SNAP reductions, the timing of both events arriving simultaneously in 2026 is not a policy design choice. It is simply what happened. The economic consequences are compounding.
How the Medicaid Cuts Are Landing in 2026
The Medicaid work requirement provisions of the OBBBA are not theoretical. Eight states had already implemented work requirements under prior federal waivers before the legislation passed. Those requirements are now being enforced under the federal mandate that took effect December 31, 2025. States that have not yet implemented their compliance systems are racing to meet a June 30, 2026 full enforcement deadline.
The CBO’s analysis of the Senate version of the bill — the version that became law — found that 11.8 million more Americans would be uninsured by 2034 compared to a scenario without the legislation. Of that figure, approximately 7.6 million represent people who lose Medicaid specifically due to the work requirement provisions and eligibility threshold changes. The remaining 4.2 million represent marketplace coverage reductions from the expiration of enhanced premium tax credits.
For the households affected, the practical consequence is not abstract. A 34-year-old warehouse worker in North Carolina who earns $2,400 a month and qualifies for Medicaid under the expansion program must now document 80 hours of qualifying monthly activity — employment, job training, or community service — or risk losing coverage. In states with technology systems that are not yet fully functional for tracking compliance, the documentation burden alone has produced coverage losses among people who technically qualify but cannot navigate the process.
The rural hospital impact is visible in the data being collected by the American Hospital Association. Hospitals in states with high Medicaid dependency are reporting measurable increases in uncompensated care costs as patients who lost coverage arrive in emergency departments with conditions that primary care would have caught earlier.
The SNAP Reduction Arriving on Top of $4.55 Gasoline
SNAP — the Supplemental Nutrition Assistance Program — was cut by $295 billion over ten years under the OBBBA, with the Agriculture Department’s ability to adjust benefit levels for actual food cost inflation removed. Benefits are now indexed to general inflation adjustments only, not to the Thrifty Food Plan calculations that previously set benefit amounts based on what a nutritionally adequate diet actually costs.
The practical difference: in a year when food prices are running above general inflation — driven in part by the Iran war’s energy cost pass-through into transportation, refrigeration, and agricultural inputs — SNAP benefits are falling short of the actual cost of the food they are supposed to purchase. The average monthly SNAP benefit per person in 2026 is $223. The USDA’s own low-cost food plan for a single adult runs approximately $270 per month. A $47 monthly gap between what the benefit pays and what a basic healthy diet costs is not a rounding error in a household earning $24,000 per year.
That household is also paying $1.57 more per gallon of gasoline than it paid in February, spending more on groceries due to supply chain energy cost pass-throughs, and may simultaneously be managing the loss of Medicaid coverage for a family member who did not successfully complete the work requirement documentation process.
The Distributional Math That Consumer Sentiment Reflects
The University of Michigan’s 44.2 consumer sentiment reading in May is a national average. The distribution beneath it is not uniform. Households earning below $35,000 per year — who disproportionately receive Medicaid, use SNAP, drive older less-fuel-efficient vehicles, and have no investment portfolio to soften the blow — are experiencing the compound pressure of the OBBBA’s benefit reductions and the Iran war’s energy costs at levels that the national average obscures.
The Institute on Taxation and Economic Policy calculated that the OBBBA’s net effect on households in the bottom 20% of the income distribution is a reduction of approximately $1,600 per year. The Iran war’s accumulated energy costs amount to an estimated $2,800 per household nationally. For a household in the bottom quintile, the combined annual economic pressure is in the range of $4,000 to $4,400 — against annual income that may not exceed $25,000.
The top 5% of earners, meanwhile, receive more than 45% of the law’s tax cuts. Their Iran war gas costs are the same dollar amount per gallon but represent a meaningfully smaller share of disposable income. Consumer sentiment surveys capture the national aggregate. They do not fully capture the depth of the pressure at the bottom, where the OBBBA and the war are not separate burdens but one continuous squeeze.
| OBBBA + Iran War Compound Impact — 2026 | Detail |
|---|---|
| OBBBA signed | July 4, 2025 |
| CBO projection: uninsured by 2034 | 11.8 million additional |
| Medicaid work requirement deadline (all states) | June 30, 2026 |
| SNAP 10-year cut | $295 billion |
| Average monthly SNAP benefit per person (2026) | $223 |
| USDA low-cost food plan (single adult monthly) | ~$270 |
| Monthly SNAP benefit gap vs. actual food cost | ~$47 |
| Share of OBBBA tax cuts to bottom 20% | Less than 1% |
| ITEP net annual impact on bottom quintile (OBBBA) | -$1,600/year |
| Iran war accumulated household energy cost | ~$2,800/year |
| Combined OBBBA + war pressure (bottom quintile est.) | $4,000–$4,400/year |
| Consumer sentiment May 2026 | 44.2 — all-time record low |
| U.S. gas price (May 31) | $4.55/gallon |
| Deficit added by OBBBA (CBO 10-year estimate) | $3.3–$3.4 trillion |
| Rural hospital uncompensated care trend | Increasing in Medicaid-dependent states |
The Interaction Effect Neither Side Modeled
When the OBBBA was scored by the CBO and debated in Congress, the Iran war had not begun. The bill’s distributional analysis was performed against a backdrop of $2.98 gasoline, 2.4% inflation, and real wages growing above the price level. None of the economic modeling incorporated the scenario that materialized in late February: a military conflict that simultaneously triggered the largest energy supply shock since 1973 while the benefit cuts the legislation contained were taking effect in households that were about to absorb that shock.
The interaction effect between a law that reduced the economic safety net for lower-income Americans and a war that imposed the equivalent of a regressive energy tax on every American household was not designed. It was not anticipated in any congressional budget analysis. It simply arrived, simultaneously, in the first quarter of 2026. The 44.2 consumer sentiment reading is the number that describes what it felt like when it did.
The Iran MOU, if signed, would begin reversing the energy component of that pressure within weeks. The OBBBA’s Medicaid and SNAP provisions are permanent law and will not reverse regardless of what happens in the Strait. The households at the intersection of both forces will feel the Iran deal’s gas price relief relatively quickly. They will feel the safety net reductions indefinitely.